User Manual
Introduction
The plugin was developed to solve the GPS lag issue occuring especially during airborne mesurements. For example - for one second one second measurement the plane / helicopter flies distance of several tens of meters.
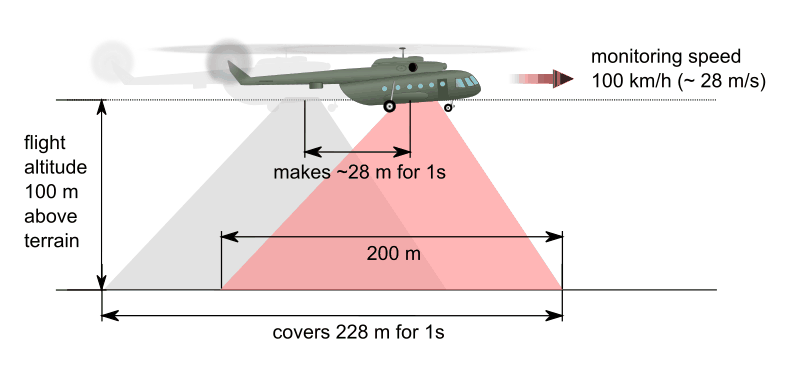
Figure 1: GPS lag occurrence.
The plugin allows user to correct a such delay of points defined by GPS coordinates in QGIS by shifting the points by values, constant distance or by constant time (variable distance considering current velocity).
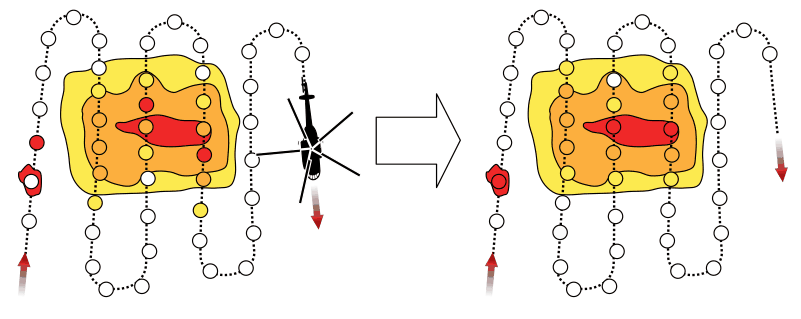
Figure 2: GPS lag correction.
You can use constant shift value if you know (of have calculated) delay for your instrument. Alternatively you can adjust the shift manually in more steps following the visual output and your expert judgement.
The plugin takes input data in CSV (more in next section) and allows shift by number of points, time or distance. Shifted data are in CSV file again but you can also save them in other format directly from QGIS.
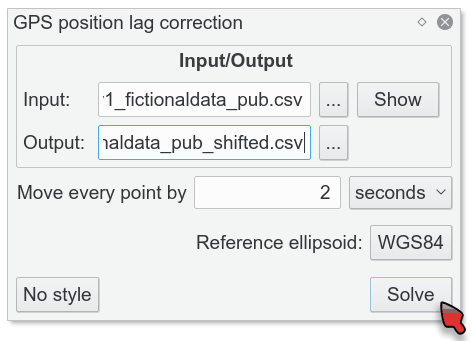
Figure 3: Plugin GUI.
Input and output
As input, you have to define the file you want to work with. You can
write the path to this file manually or use the button with
.... By clicking on this button, you will get the dialog intended
to choose your file. Click on OK will insert this path to the basic
interface. Click on Cancel will interrupt the choosing dialog, and the
input path will not be changed.
The same procedure is with output, but there you define the path where the new file will be created. The choosing dialog for output is intended to choose folder, not file.
Input data structure
The plugin works with data in CSV format and requires certain fields to work properly:
Input CSV contents
lat_deg:    Latitude of point
lon_deg:    Longitude of point
Gtm_sec:    Time stamp of measuring in seconds
Tip
See sample data in plugin repository.
Provided sample data consists of three datasets. First and second have spatial extend and number of points corresponding to common airborne monitoring flight. Third is much bigger and was created for “stress tests” of the plugin. Values in “measurement” are also fictional variable but retains relative value differences from real monitoring data. Structure of provided files is following:
Line,RECS,UsedAlt_m,GHead_deg,Lat_deg,Lon_deg,Galt_m,Gtm_sec,measurement
900,402,125,211,49.311943,15.980162,684.40,24636,1217.71
900,403,124,211,49.311470,15.979719,683.90,24637,1378.70
900,404,124,211,49.310998,15.979276,683.70,24638,1268.23
There is also an optional possibility of styling your points for better visualisation.
Reference ellipsoid
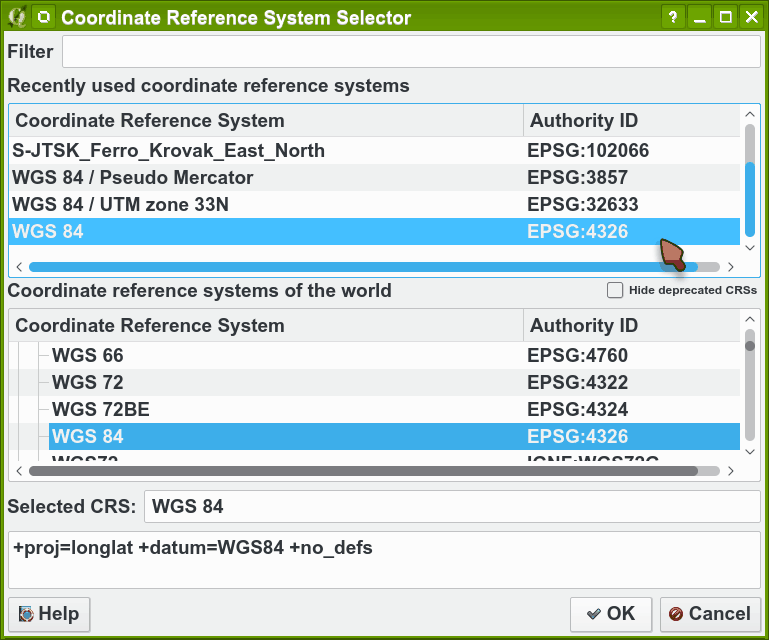
User is allowed to choose a reference ellipsoid by clicking at the ellipsoid button. It opens a CRS selector dialog where user can pick the used ellipsoid. Ellipsoid is drawn out of the CRS after choosing one. For not-known ellipsoids it returns WGS84 (EPSG: 4326) by default.
Styling
By default, you have not defined any style, points will be created in
the default QGIS style (on Style button is written No style). If
you want to apply your own style, you have to click on this
button. You will get the browsing dialog. You are automatically
directed to folder styles in the plugin folder; here you can
choose desired QML file and click OK. Click on Cancel interrupts the
dialog and sets again No style. If you choose your own style, you
will see its name on the style button.
Plugin comes with two presetted styles adjusted for the fictional data
provided as samples. However, the user is allowed to import his own
styles. Styling is based on the value in column measurement by
default.
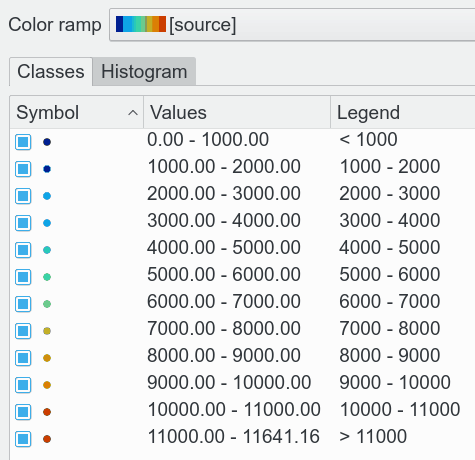
Figure 5: Predefined style example.
If user prefers to visualise both the input and the output from one
dialog, it is allowed by the Show button. Input layer is also
styled and it gives user the opportunity to compare the shifted values
with the original ones.
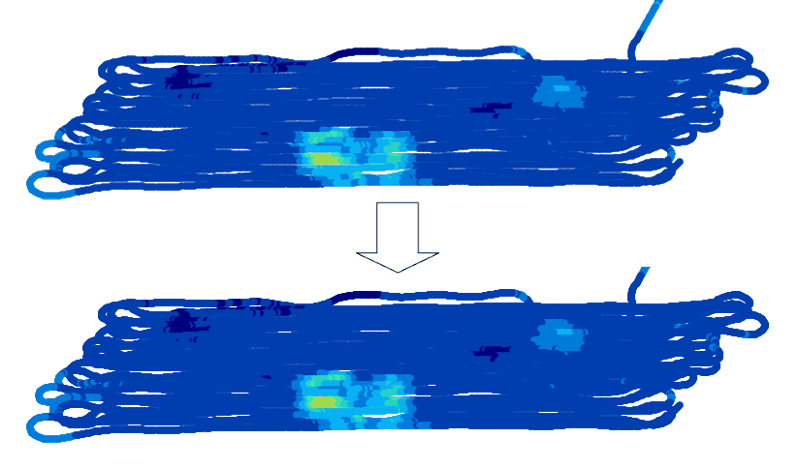
Figure 6: Comparison of two screenshots - upper is original, lower is shifted.
Shift
Shift is done by clicking on the button Solve. User should define
value of shift and can choose units - values, meters (distance) or
seconds (variable distance considering current velocity). Points are
shifted on a trajectory.
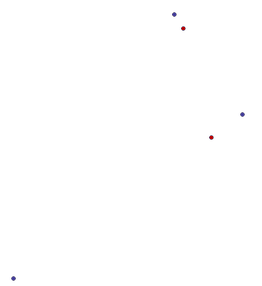
Figure 7: Red ones shifted by 1.14 seconds.